Dashboard
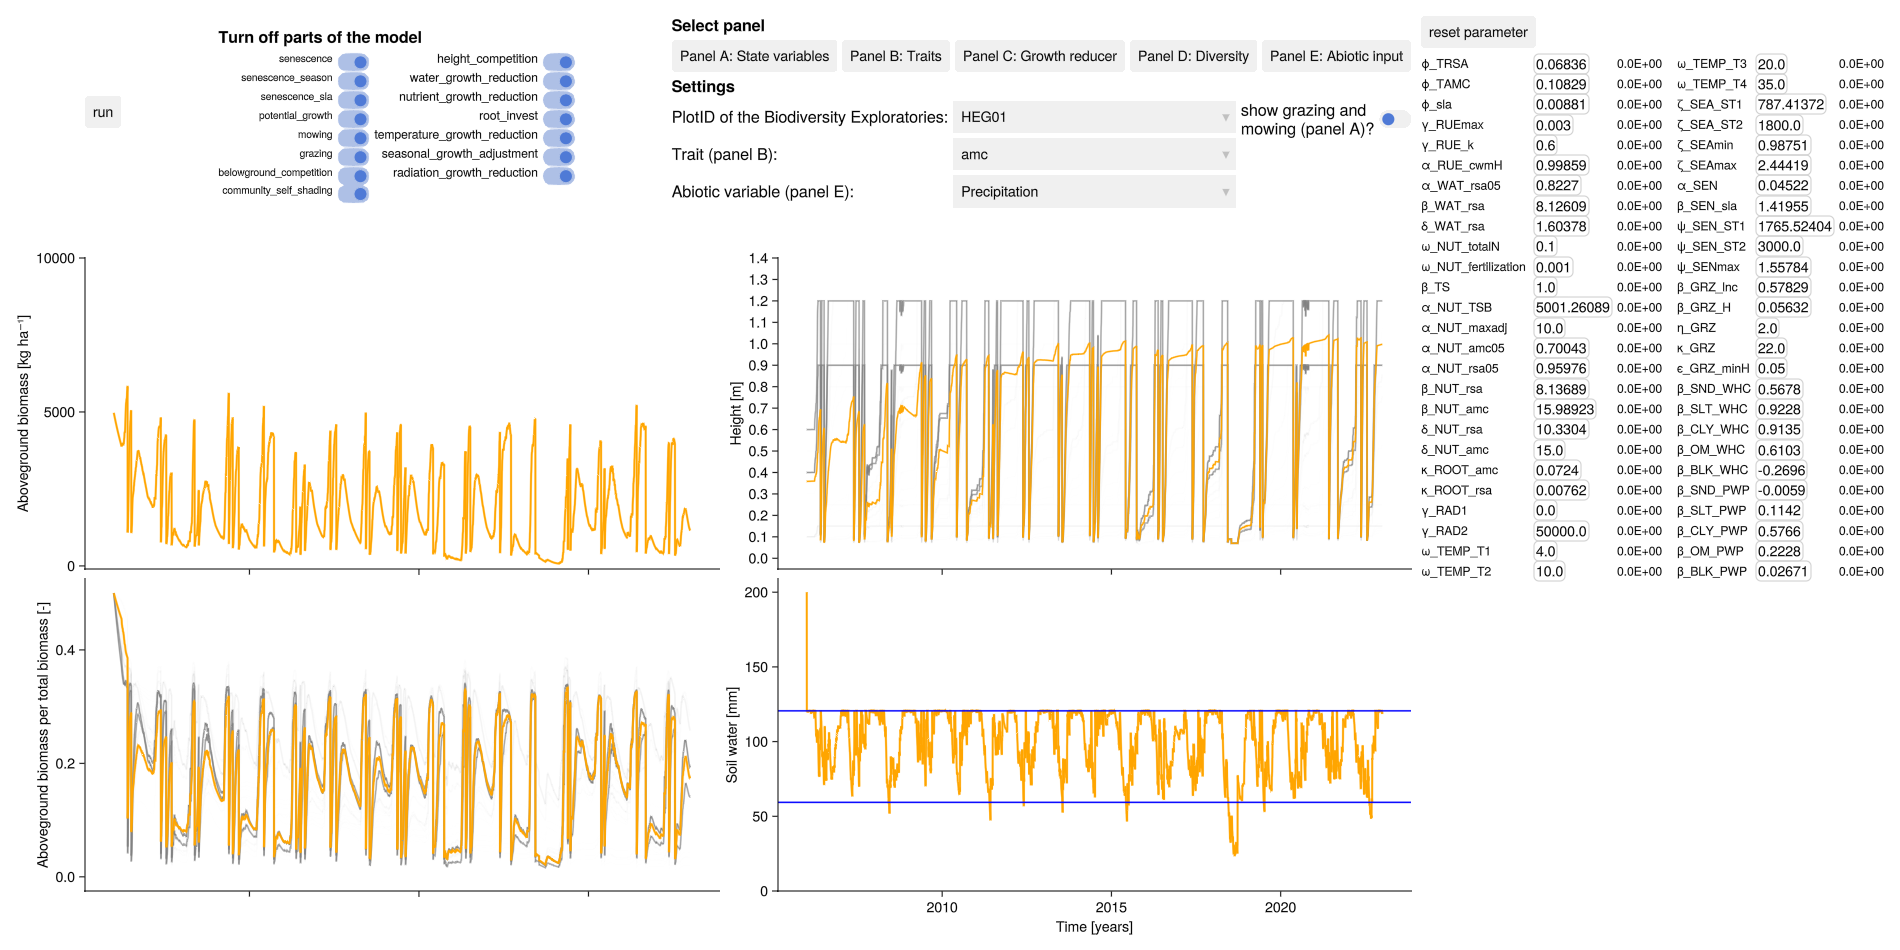
The dashboard can be used to graphically check the calibration results. It shows the simulated total biomass, soil water content and the simulated community weighted mean traits for all grassland plots of the Biodiversity Exploratories.
GLMakie.jl is used instead of CairoMakie.jl to take advantage of interactive features and must be loaded explicitly. What can be done:
see simulation results for different grassland plots with the
plotID(per default for three sites of the Biodiversity Exploratories, see tutorial how to use your input)manually change each parameter value
disable individual model components
view different abiotic inputs (e.g. precipitation, air temperature)
show the timing of the grazing and mowing in the biomass plot
in all plots it is possible to zoom
import GrasslandTraitSim as sim
using GLMakie
GLMakie.activate!()

# load own data with:
# sim.load_data("your_data_path_here")

sim.dashboard()

# note: if you want to switch back to CairoMakie
# using CairoMakie; CairoMakie.activate!()
Code for generating static image for documentation
import GrasslandTraitSim as sim
using GLMakie
GLMakie.activate!()

sim.dashboard(; variable_p = sim.load_optim_result(), path = "dashboard.png")