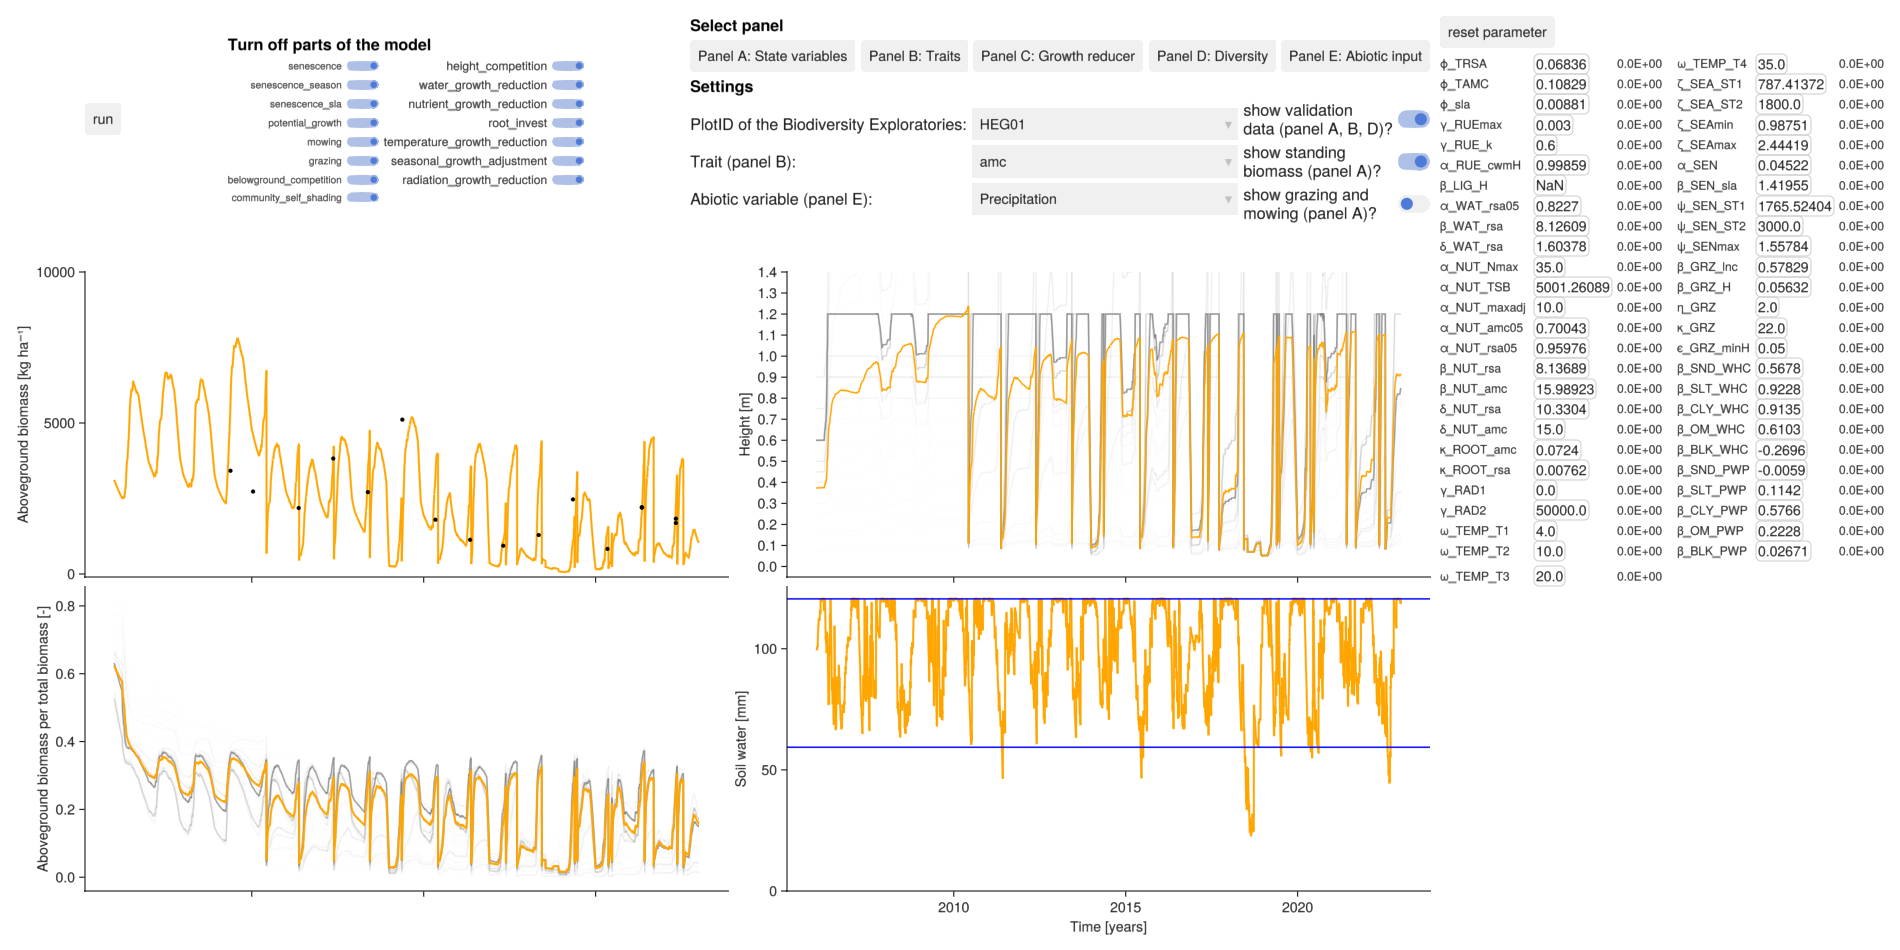
Dashboard
The dashboard can be used to graphically check the calibration results. It shows the simulated total biomass, soil water content and the simulated community weighted mean traits for all grassland plots of the Biodiversity Exploratories.
GLMakie.jl is used instead of CairoMakie.jl to take advantage of interactive features and must be loaded explicitly. What can be done:
see simulation results for different grassland plots of the Biodiversity Exploratories with the
plotIDsample parameter values from the prior and in the future also from the posterior
manually change each parameter value, set Parameter to "fixed (see right)"
disable individual model components
view different abiotic inputs (e.g. precipitation, air temperature)
see the log likelihood for the simulated community weighted traits and the cut aboveground biomass, it is compared to measured data from the Biodiversity Exploratories
calculate the gradient of each parameter with respect to the log likelihood
show the timing of the grazing and mowing in the biomass plot
change the time step of the simulation: 1, 7, or 14 days
in all plots it is possible to zoom
import GrasslandTraitSim as sim
using GLMakie
GLMakie.activate!()

sim.dashboard()

# note: if you want to switch back to CairoMakie
# using CairoMakie; CairoMakie.activate!()
Code for generating static image for documentation
import GrasslandTraitSim as sim
using GLMakie
GLMakie.activate!()

sim.dashboard(; variable_p = sim.load_optim_result(), path = "dashboard.png")