Influence of intermediate variables
Trade-off between investing in roots and experiencing nutrient stress
plants with a high investment into roots have a high arbuscular mycorrhizal colonisation rate and a high root surface area per belowground biomass
low growth reduction due to nutrient stress
investment costs energy, this is implemented by a growth reducer that is independent of the nutrient level
nutrient stress is stronger if the total biomass is high, because of the strong competition for nutrients, see
nutrient_competition!
show code
julia
using CairoMakie
using Unitful
import GrasslandTraitSim as sim

let
    lastn_points = 1500

    trait_input = sim.input_traits();
    input_obj = sim.validation_input("HEG01");
    p = sim.optim_parameter()
    sol = sim.solve_prob(; input_obj, p, trait_input);
    t = sol.simp.mean_input_date_num[end-lastn_points:end]
    t_out = sol.simp.output_date_num[end-lastn_points:end]
    total_biomass = ustrip.(vec(sum(sol.output.biomass[end-lastn_points:end, 1, 1, :];
                                    dims = :species)))


    fig = Figure(size = (900, 800))

    Axis(fig[1, 1:2];
         xticklabelsvisible = false, xticksvisible = true,
         xticks = 2018:1:2022, ylabel = "Total biomass\n[kg ha⁻¹]")
    lines!(t_out, total_biomass;
            linewidth = 2, color = :black)


    c = vec(sol.calc.root_invest_amc .* sol.calc.root_invest_srsa)
    colorrange = (minimum(c), maximum(c))
    species_order = sortperm(c)
    colormap = :redsblues

    Axis(fig[2, 1:2];
         xticks = 2018:1:2022,
         ylabel = "Growth reduction factor\ndue to nutrient stress [-]\n← stronger reduction, less reduction →",
         xlabel = "Time [year]")
    for s in sortperm(c)[[1, 2, 3, 4, 5, 39, 40, 41, 42, 43]]
        lines!(t, vec(sol.output.nutrient_growth[end-lastn_points:end, 1, 1, s]);
               colorrange, colormap, color = c[s], linewidth = 1)
    end

    ax1 = Axis(fig[3, 1];
        xlabel = "Root suface area per\nbelowground biomass [m² g⁻¹]",
        ylabel = "Growth reduction due to investment\ninto roots, single effects [-]\n← stronger reduction, less reduction →")
    scatter!(ustrip.(sol.traits.rsa), sol.calc.root_invest_srsa;
            color = c, colormap,
            markersize = 10)

    ax2 = Axis(fig[3, 2];
        xlabel = "Arbuscular mycorrhiza\ncolonisation rate [-]",
        yticklabelsvisible = false)
    scatter!(sol.traits.amc, sol.calc.root_invest_amc;
            color = c, colormap,
            markersize = 10)
    linkyaxes!(ax1, ax2)

    Colorbar(fig[2:3, 3]; colorrange, colormap,
        label = "Growth reduction due to investment into roots, multiplicative effect of both factors [-]\n← stronger reduction, less reduction →")

    rowsize!(fig.layout, 1, Relative(0.1))
    rowgap!(fig.layout, 1, 5)
    rowgap!(fig.layout, 2, 10)
    colgap!(fig.layout, 1, 5)

    fig
end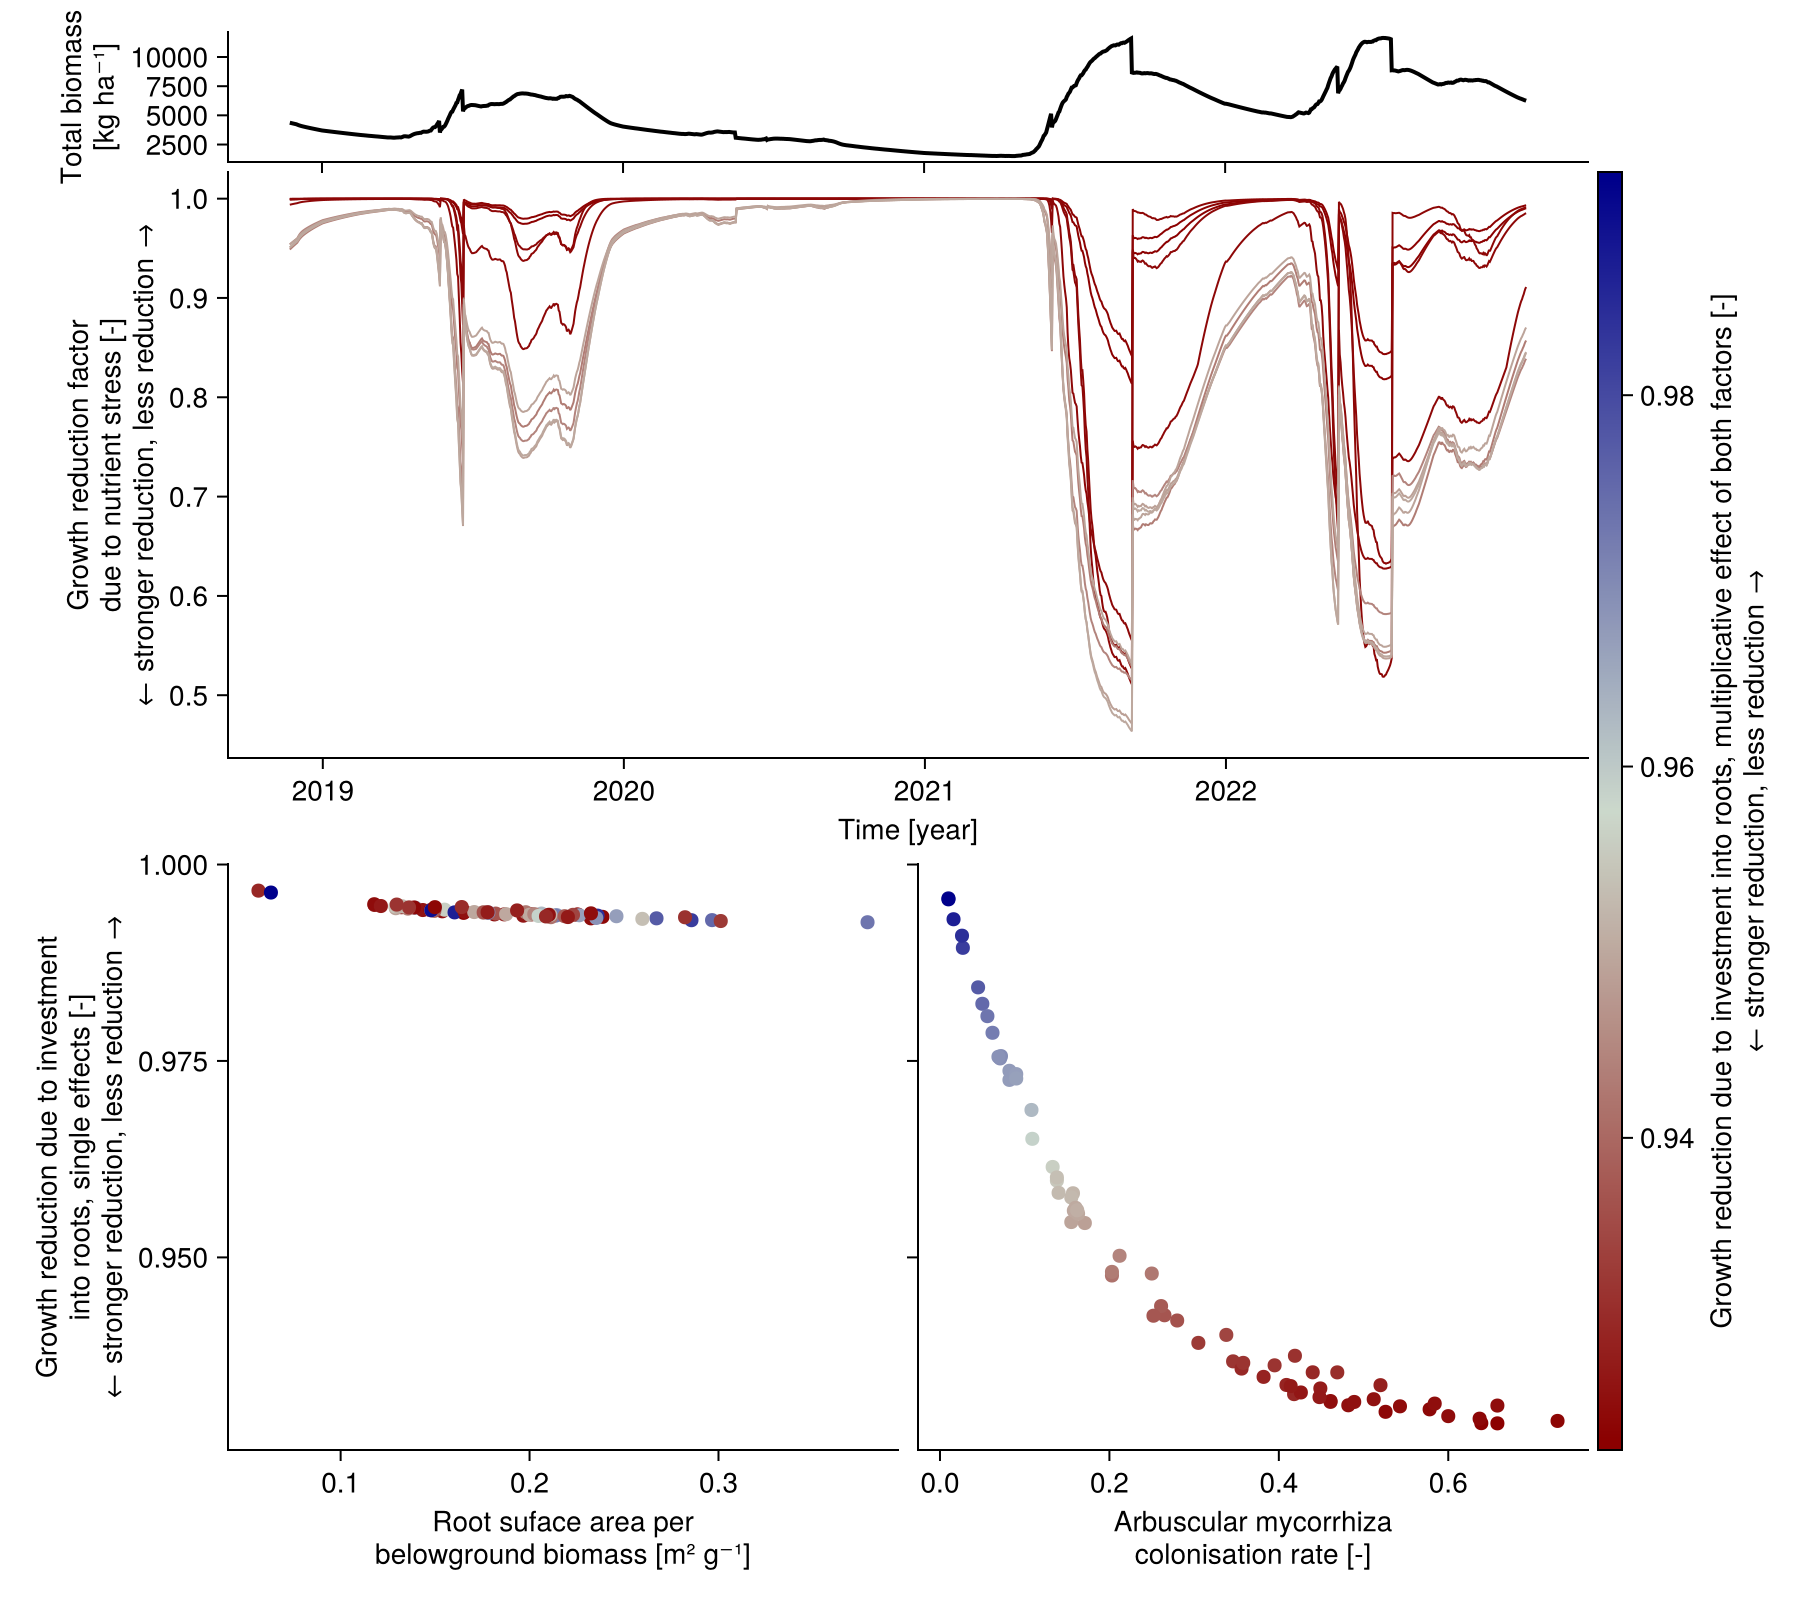
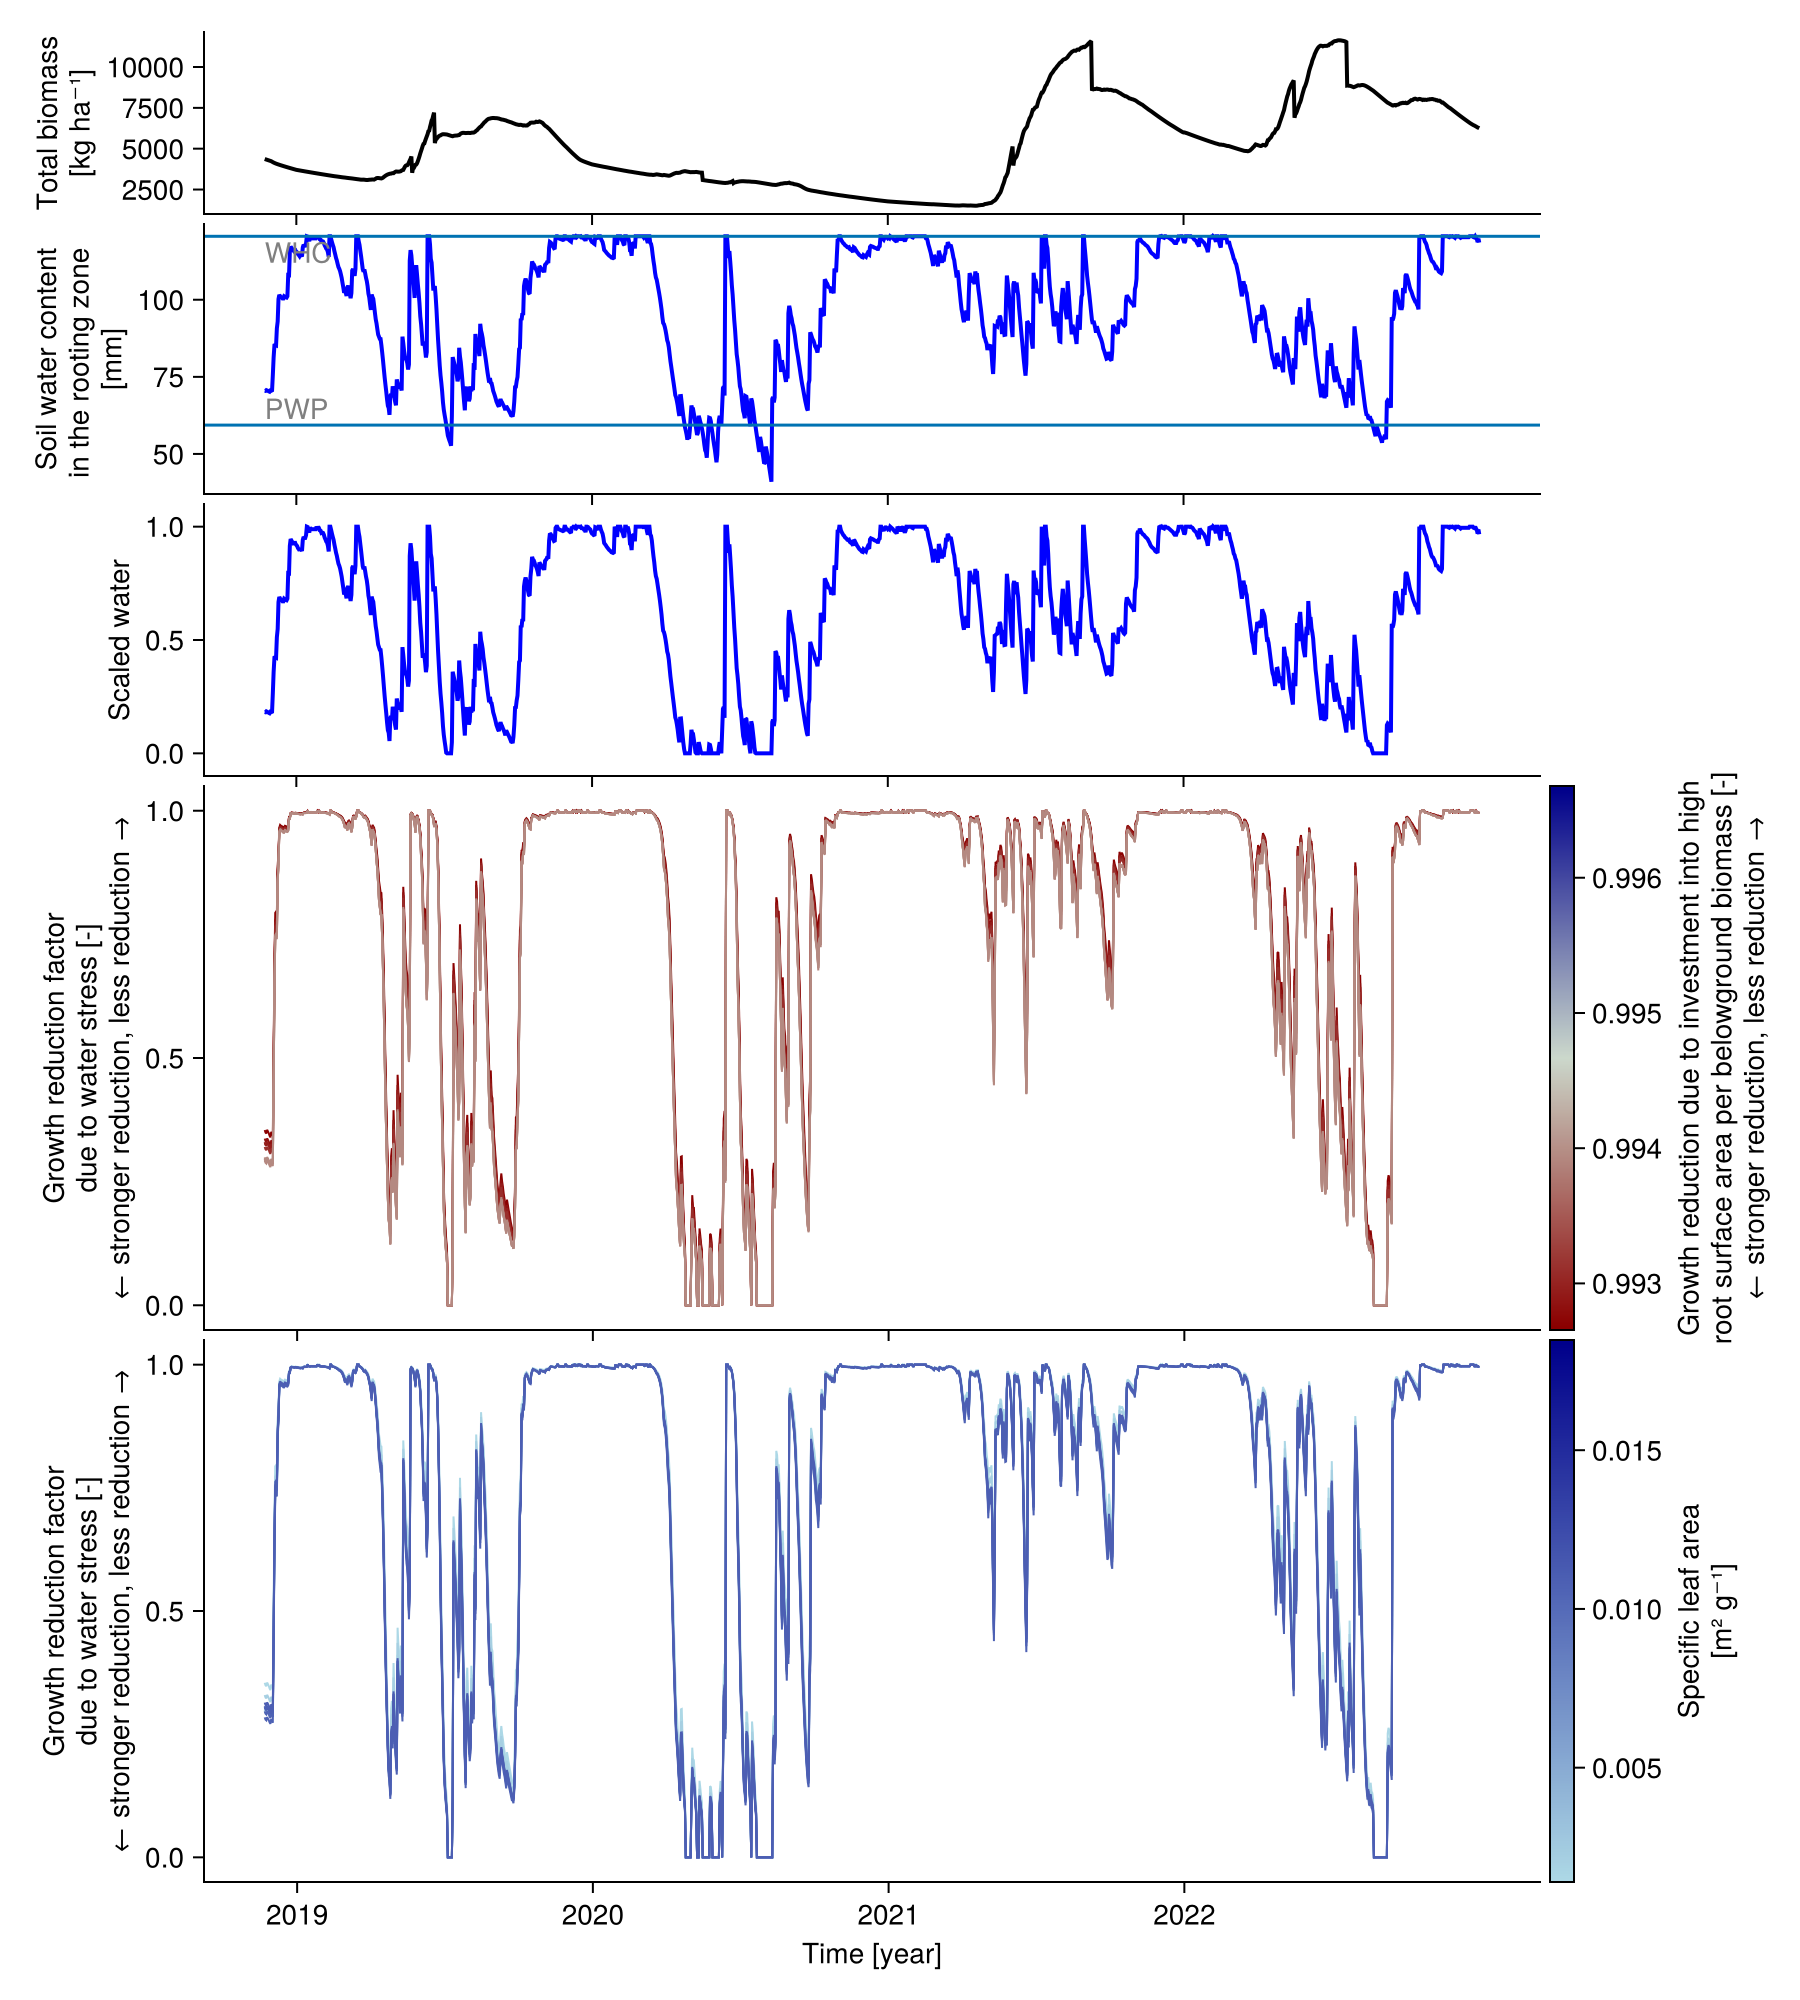
Trade-off between investing in roots and experiencing water stress
a high root surface area per belowground biomass reduces water stress but the investment costs energy (see figure above)
a low specific leaf area (leafs are thick) reduces water stress but plants with a high specific leaf area have a higher leaf area index and can intercept more light
show code
julia
using CairoMakie
using Unitful
import GrasslandTraitSim as sim

let
    lastn_points = 1500

    trait_input = sim.input_traits();
    input_obj = sim.validation_input("HEG01";
                                    included = (;
                                        belowground_competition = true,
                                        nutrient_growth_reduction = true,
                                        water_growth_reduction = true,
                                        root_invest = true));
    p = sim.optim_parameter()
    sol = sim.solve_prob(; input_obj, p, trait_input);
    t = sol.simp.mean_input_date_num[end-lastn_points:end]
    t_out = sol.simp.output_date_num[end-lastn_points:end]
    total_biomass = ustrip.(vec(sum(sol.output.biomass[end-lastn_points:end, 1, 1, :];
                                    dims = :species)))

    PWP = sol.patch_variables.PWP[1, 1]
    WHC = sol.patch_variables.WHC[1, 1]
    water_out = vec(sol.output.water[end-lastn_points:end, 1, 1])

    function get_Wsc(x; WHC, PWP)
        return x > WHC ? 1.0 : x > PWP ? (x - PWP) / (WHC - PWP) : 0.0
    end

    water_scaled = get_Wsc.(water_out; WHC, PWP)


    fig = Figure(size = (900, 1000))

    Axis(fig[1, 1];
        xticklabelsvisible = false,
        xticks = 2018:1:2022, ylabel = "Total biomass\n[kg ha⁻¹]")
    lines!(t_out, total_biomass;
            linewidth = 2, color = :black)

    Axis(fig[2, 1];
        xticklabelsvisible = false,
        xticks = 2018:1:2022, ylabel = "Soil water content\nin the rooting zone \n[mm]")
    lines!(t_out, ustrip.(water_out);
            linewidth = 2, color = :blue)
    hlines!(ustrip.([PWP, WHC]))
    text!([t_out[1], t_out[1]], ustrip.([PWP, WHC]);
          text = ["PWP", "WHC"],
          align = [(:left, :bottom), (:left, :top)],
          color = :grey)

    Axis(fig[3, 1];
        xticklabelsvisible = false,
        xticks = 2018:1:2022, ylabel = "Scaled water",
        limits = (nothing, nothing, -0.1, 1.1))
        lines!(t_out, water_scaled;
                linewidth = 2, color = :blue)

    c = vec(sol.calc.root_invest_srsa)
    colorrange = (minimum(c), maximum(c))
    species_order = sortperm(c)
    colormap = :redsblues
    Axis(fig[4, 1];
        xticks = 2018:1:2022, xticklabelsvisible = false,
        ylabel = "Growth reduction factor\ndue to water stress [-]\n← stronger reduction, less reduction →")
    for s in sortperm(c)[[1, 2, 3, 4, 5, 39, 40, 41, 42, 43]]
        lines!(t, vec(sol.output.water_growth[end-lastn_points:end, 1, 1, s]);
            colorrange, colormap, color = c[s], linewidth = 1)
    end
    Colorbar(fig[4, 2]; colorrange, colormap,
        label = "Growth reduction due to investment into high\nroot surface area per belowground biomass [-]\n← stronger reduction, less reduction →")


    c = ustrip.(sol.traits.sla)
    colorrange = (minimum(c), maximum(c))
    species_order = sortperm(c)
    colormap = :blues
    Axis(fig[5, 1];
        xticks = 2018:1:2022,
        ylabel = "Growth reduction factor\ndue to water stress [-]\n← stronger reduction, less reduction →",
        xlabel = "Time [year]")
    for s in sortperm(c)[[1, 2, 3, 4, 5, 39, 40, 41, 42, 43]]
        lines!(t, vec(sol.output.water_growth[end-lastn_points:end, 1, 1, s]);
            colorrange, colormap, color = c[s], linewidth = 1)
    end
    Colorbar(fig[5, 2]; colorrange, colormap,
        label = "Specific leaf area\n[m² g⁻¹]")

    rowsize!(fig.layout, 1, Relative(0.1))
    rowsize!(fig.layout, 2, Relative(0.15))
    rowsize!(fig.layout, 3, Relative(0.15))

    fig
end