Using different time steps
Input rescaled to different time steps
julia
using CairoMakie
using Unitful
using Statistics
import GrasslandTraitSim as sim

function plot_input_time_steps(input_obj1, input_obj2)
     idate_1 = input_obj1.simp.mean_input_date_num
     idate_long = input_obj2.simp.mean_input_date_num

     fig = Figure(size = (500, 1400))

     Axis(fig[1, 1]; ylabel = "Temperature [°C]",
          xticklabelsvisible = false)
     lines!(idate_1, vec(ustrip.(input_obj1.input.temperature)), color = :red, alpha = 0.3)
     lines!(idate_long, vec(ustrip.(input_obj2.input.temperature)))

     Axis(fig[2, 1]; ylabel = "Temperature sum [°C]",
          xticklabelsvisible = false)
     lines!(idate_1, vec(ustrip.(input_obj1.input.temperature_sum)), color = :red, alpha = 0.3)
     lines!(idate_long, vec(ustrip.(input_obj2.input.temperature_sum)))

     Axis(fig[3, 1]; ylabel = "Mean photosynthetically\nactive radiation [MJ ha⁻¹]",
          xticklabelsvisible = false)
     lines!(idate_1, vec(ustrip.(input_obj1.input.PAR)), color = :red, alpha = 0.3)
     lines!(idate_long, vec(ustrip.(input_obj2.input.PAR)))

     Axis(fig[4, 1]; ylabel = "Potential\nevapotranspiration\n[mm d⁻¹]",
          xticklabelsvisible = false)
     lines!(idate_1, vec(ustrip.(input_obj1.input.PET)), color = :red, alpha = 0.3)
     lines!(idate_long, vec(ustrip.(input_obj2.input.PET)))


     Axis(fig[5, 1]; ylabel = "Precipitation [mm d⁻¹]", xticklabelsvisible = false)
     lines!(idate_1, vec(ustrip.(input_obj1.input.precipitation)), color = :red, alpha = 0.3,
               label = "$(input_obj1.simp.time_step_days.value) day")
     lines!(idate_long, vec(ustrip.(input_obj2.input.precipitation)) ./
               input_obj2.simp.time_step_days.value, label = "$(input_obj2.simp.time_step_days.value) days")
     axislegend("Time step"; position = :lt, framevisible = false)

     Axis(fig[6, 1]; limits = (nothing, nothing, 0, 1), ylabel = "Mowing events",
          xticklabelsvisible = false)
     vlines!(idate_1[.! ismissing.(input_obj1.input.CUT_mowing)], color = :red, alpha = 0.5)
     vlines!(idate_long[ .! ismissing.(input_obj2.input.CUT_mowing)], linestyle = :dash)

     new_f = .!ismissing.(input_obj2.input.LD_grazing)
     new_date = idate_long[new_f]
     new_low = zeros(length(new_date))
     new_up = ustrip.(input_obj2.input.LD_grazing[new_f])
     old_f = .!ismissing.(input_obj1.input.LD_grazing)
     old_date = idate_1[old_f]
     old_low = zeros(length(old_date))
     old_up = ustrip.(input_obj1.input.LD_grazing[old_f])
     Axis(fig[7, 1]; ylabel = "Grazing [LD ha⁻¹ d⁻¹]", xlabel = "Time [year]")
     rangebars!(old_date, old_low, old_up; color = (:red, 0.1))
     rangebars!(new_date, new_low, new_up ./ input_obj2.simp.time_step_days.value)

     fig
end

trait_input = sim.input_traits()
input_obj_1 = sim.validation_input("HEG01");

input14_HEG01 = sim.scale_input(sim.input_data.HEG01; time_step_days = 14)
input_obj_14 = sim.validation_input(input14_HEG01);
plot_input_time_steps(input_obj_1, input_obj_14)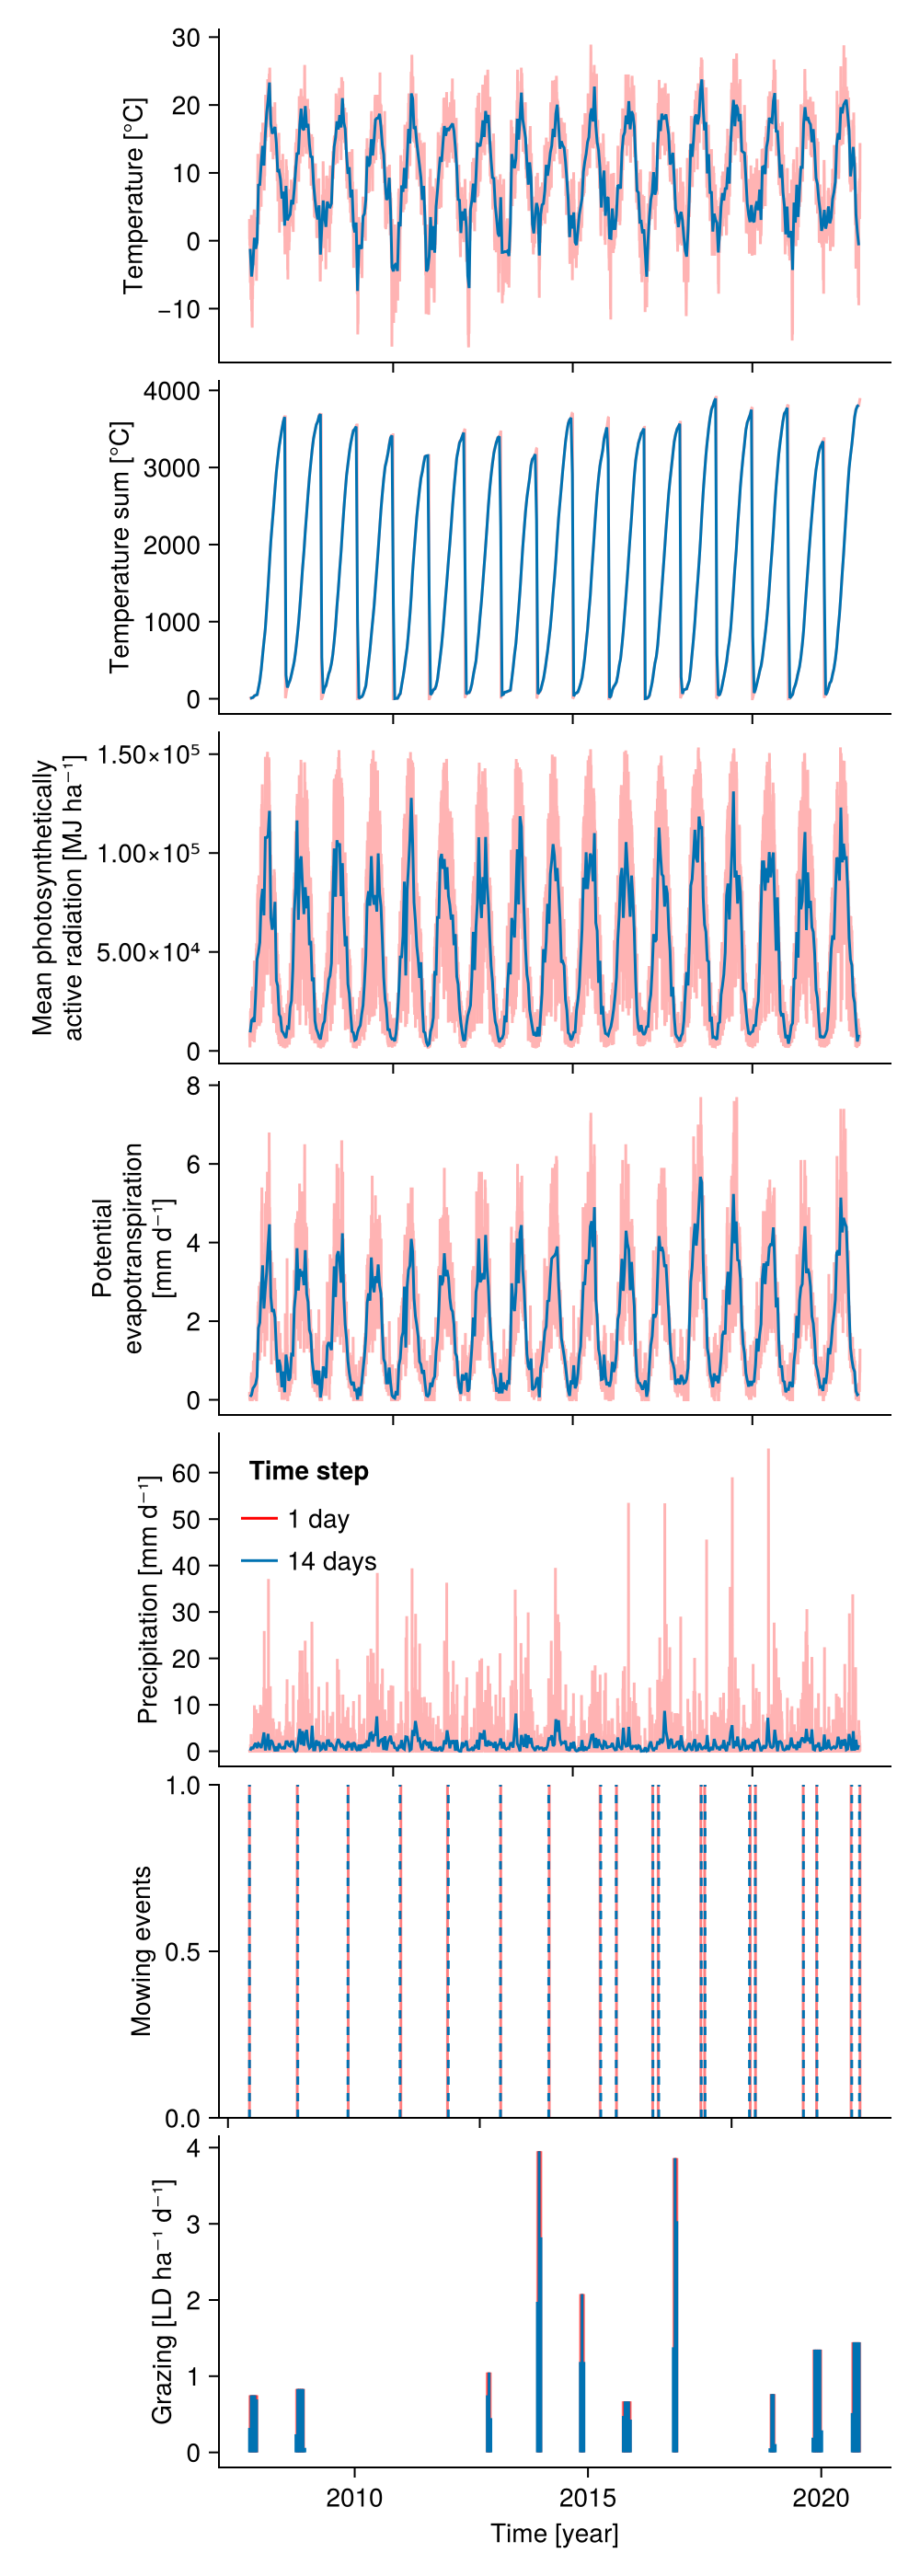
Test processes for different time steps
julia
function calc_total_biomass(included, input14; plotID = "HEG01")
     trait_input = sim.input_traits();
     nspecies = length(trait_input.amc)
     p = sim.SimulationParameter()
     input_obj_1 = sim.validation_input(plotID; nspecies, included);
     input_obj_14 = sim.validation_input(input14; nspecies, included);

     sol_1 = sim.solve_prob(; input_obj=input_obj_1, p, trait_input);
     sol_14 = sim.solve_prob(; input_obj=input_obj_14, p, trait_input);

     species_biomass_1 = dropdims(mean(sol_1.output.biomass; dims = (:x, :y)); dims = (:x, :y))
     total_biomass_1 = vec(sum(species_biomass_1; dims = :species))
     species_biomass_14 = dropdims(mean(sol_14.output.biomass; dims = (:x, :y)); dims = (:x, :y))
     total_biomass_14 = vec(sum(species_biomass_14; dims = :species))

     return ustrip.(total_biomass_1), ustrip.(total_biomass_14), sol_1.simp.output_date_num, sol_14.simp.output_date_num
end


########### Only senescence
included = (;
            senescence = true,
            senescence_season = true,
            senescence_sla = true,
            potential_growth = false,
            mowing = false,
            grazing = false,
            belowground_competition = false,
            community_self_shading = false,
            height_competition = false,
            pet_growth_reduction = false,
            sla_transpiration = false,
            water_growth_reduction = false,
            nutrient_growth_reduction = false,
            temperature_growth_reduction = false,
            seasonal_growth_adjustment = false,
            radiation_growth_reduction = false)
b1, b14, t1, t14 = calc_total_biomass(included, input14_HEG01)
fig = Figure()
Axis(fig[1, 1], ylabel = "Aboveground dry biomass [kg ha⁻¹]",
                xlabel = "Time [year]",
                title = "Only senescence")
lines!(t1, b1; linestyle = :dash, label = "1 day")
lines!(t14, b14; label = "14 days", color = :red, alpha = 0.5)
axislegend("Time step"; position = :rt, framevisible = false)
fig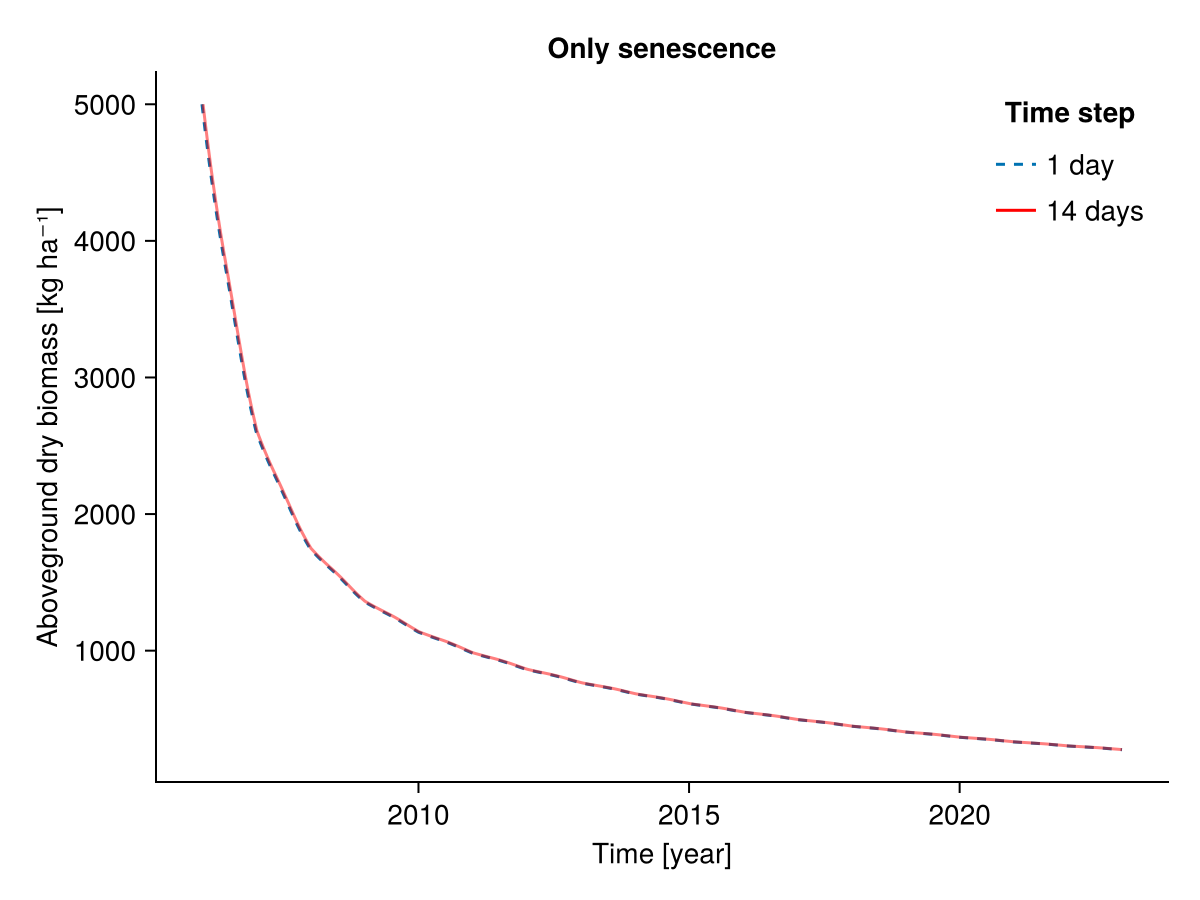
julia
########### Only potential growth
included = (;
            senescence = false,
            senescence_season = false,
            potential_growth = true,
            mowing = false,
            grazing = false,
            belowground_competition = false,
            community_self_shading = false,
            height_competition = false,
            pet_growth_reduction = false,
            sla_transpiration = false,
            water_growth_reduction = false,
            nutrient_growth_reduction = false,
            temperature_growth_reduction = false,
            seasonal_growth_adjustment = false,
            radiation_growth_reduction = false)
b1, b14, t1, t14 = calc_total_biomass(included, input14_HEG01)
fig = Figure()
Axis(fig[1, 1], ylabel = "Aboveground dry biomass [kg ha⁻¹]",
                xlabel = "Time [year]",
                title = "Only potential growth")
lines!(t1, b1; linestyle = :dash, label = "1 day")
lines!(t14, b14; label = "14 days", color = :red, alpha = 0.5)
axislegend("Time step"; position = :lt, framevisible = false)
fig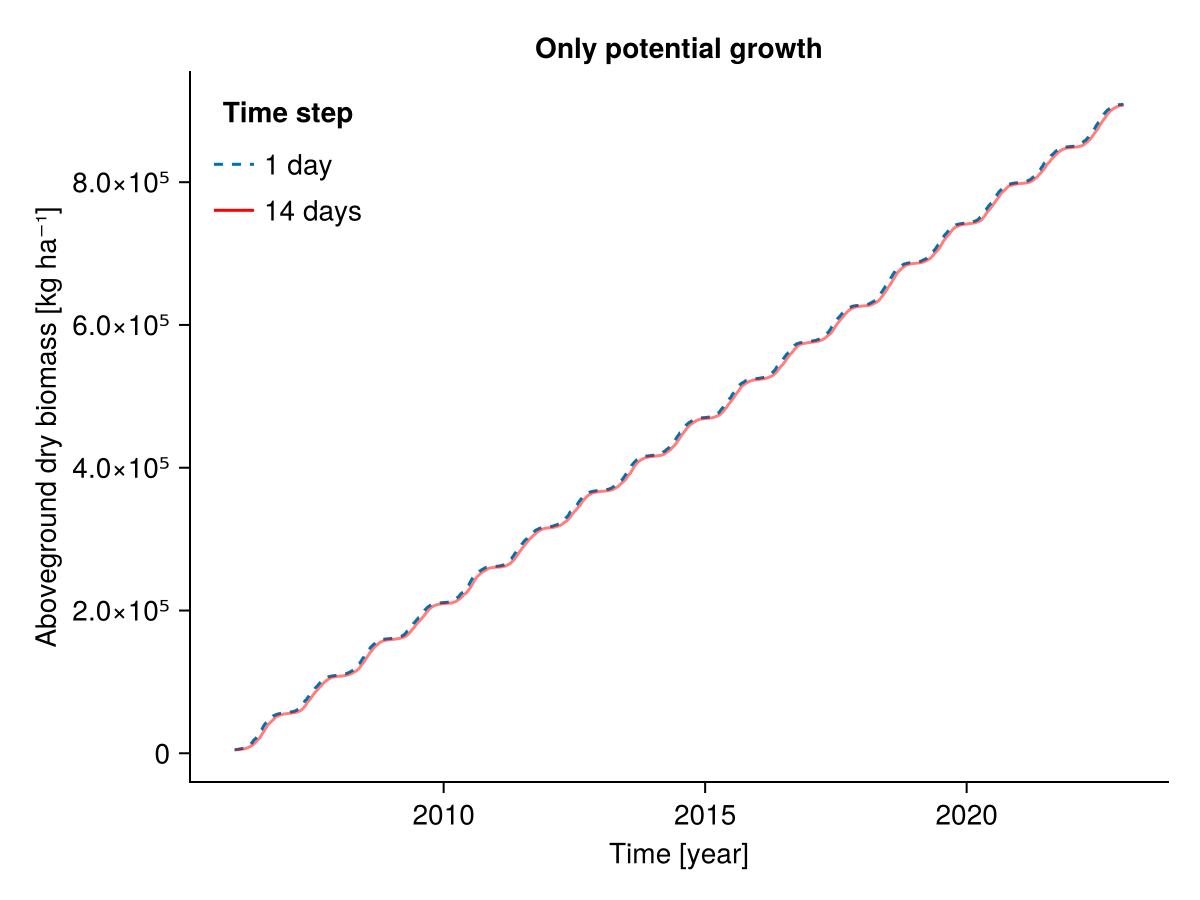
julia
########### Only mowing
included = (;
            senescence = false,
            senescence_season = false,
            potential_growth = false,
            mowing = true,
            grazing = false,
            belowground_competition = false,
            community_self_shading = false,
            height_competition = false,
            pet_growth_reduction = false,
            sla_transpiration = false,
            water_growth_reduction = false,
            nutrient_growth_reduction = false,
            temperature_growth_reduction = false,
            seasonal_growth_adjustment = false,
            radiation_growth_reduction = false)
b1, b14, t1, t14 = calc_total_biomass(included, input14_HEG01)
fig = Figure()
Axis(fig[1, 1], ylabel = "Aboveground dry biomass [kg ha⁻¹]",
                xlabel = "Time [year]",
                title = "Only mowing")
lines!(t1, b1; linestyle = :dash, label = "1 day")
lines!(t14, b14; label = "14 days", color = :red, alpha = 0.5)
axislegend("Time step"; position = :rt, framevisible = false)
fig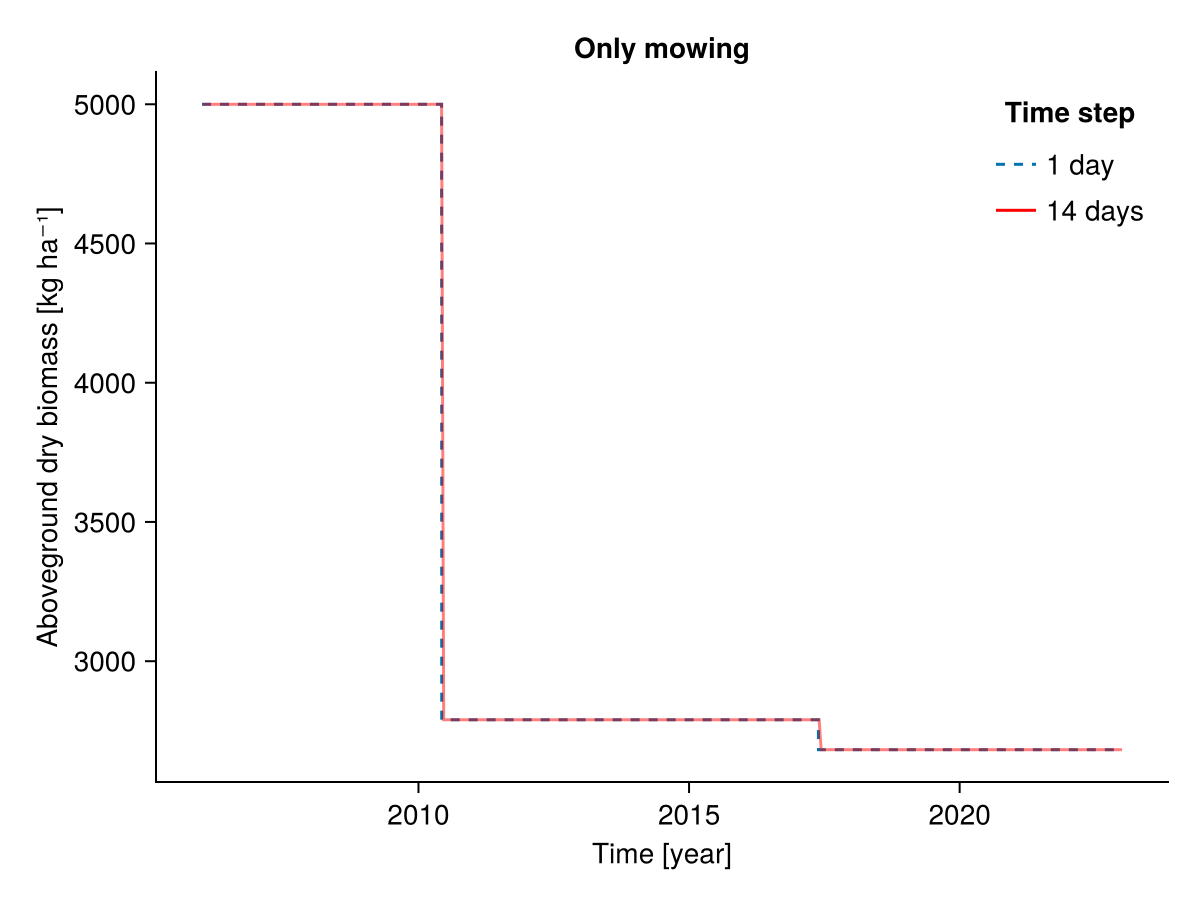
julia
########### Only grazing
included = (;
            senescence = false,
            senescence_season = false,
            potential_growth = false,
            mowing = false,
            grazing = true,
            belowground_competition = false,
            community_self_shading = false,
            height_competition = false,
            pet_growth_reduction = false,
            sla_transpiration = false,
            water_growth_reduction = false,
            nutrient_growth_reduction = false,
            temperature_growth_reduction = false,
            seasonal_growth_adjustment = false,
            radiation_growth_reduction = false)
b1, b14, t1, t14 = calc_total_biomass(included, input14_HEG01)
fig = Figure()
Axis(fig[1, 1], ylabel = "Aboveground dry biomass [kg ha⁻¹]",
                xlabel = "Time [year]",
                title = "Only grazing")
lines!(t1, b1; label = "1 day", color = :red, alpha = 0.5)
lines!(t14, b14; label = "14 days", linestyle = :dash)
axislegend("Time step"; position = :rt, framevisible = false)
fig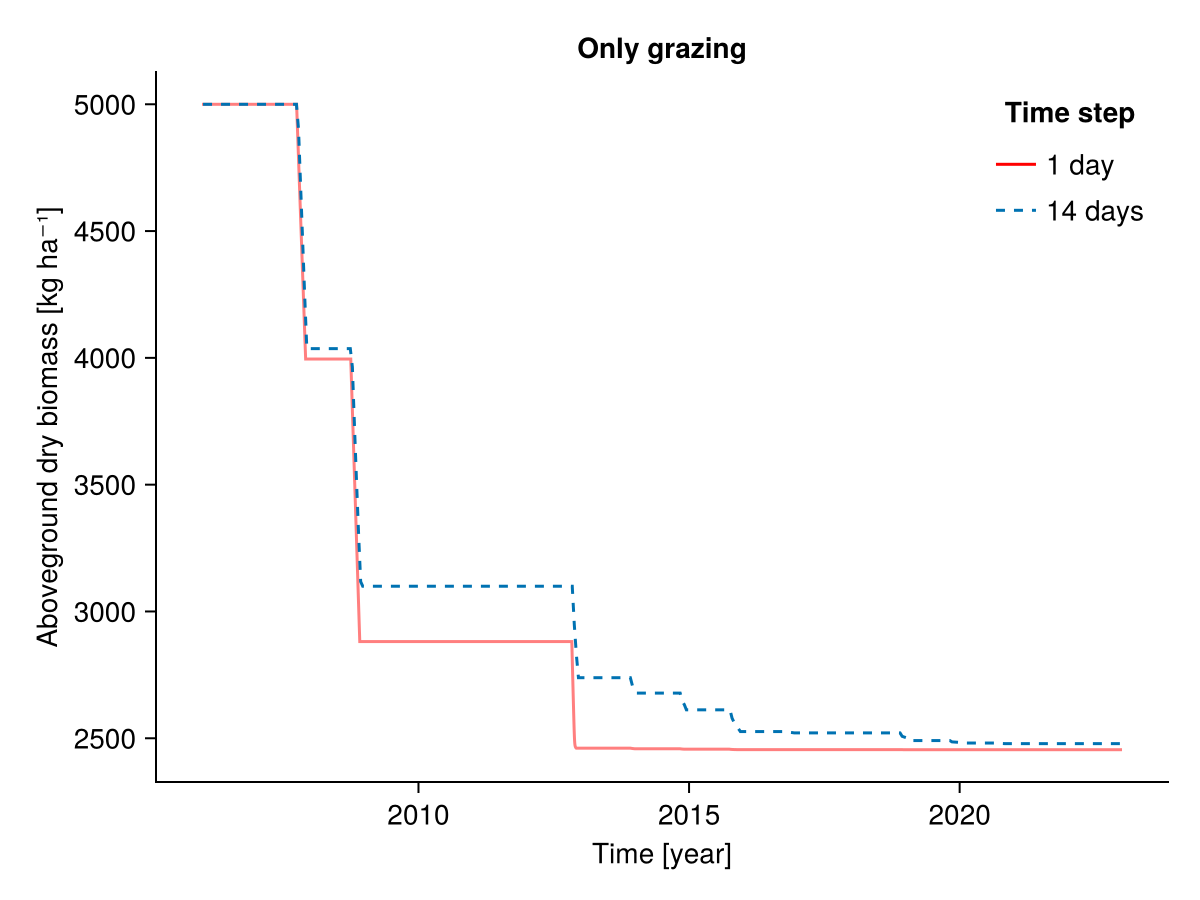
julia
########### Only potential growth + radiation reduction
included = (;
            senescence = false,
            senescence_season = false,
            potential_growth = true,
            mowing = false,
            grazing = false,
            belowground_competition = false,
            community_self_shading = false,
            height_competition = false,
            pet_growth_reduction = false,
            sla_transpiration = false,
            water_growth_reduction = false,
            nutrient_growth_reduction = false,
            temperature_growth_reduction = false,
            seasonal_growth_adjustment = false,
            radiation_growth_reduction = true)
b1, b14, t1, t14 = calc_total_biomass(included, input14_HEG01)
fig = Figure()
Axis(fig[1, 1], ylabel = "Aboveground dry biomass [kg ha⁻¹]",
                xlabel = "Time [year]",
                title = "Only potential growth + radiation reduction")
lines!(t1, b1; label = "1 day", color = :red, alpha = 0.5)
lines!(t14, b14; label = "14 days", linestyle = :dash)
axislegend("Time step"; position = :lt, framevisible = false)
fig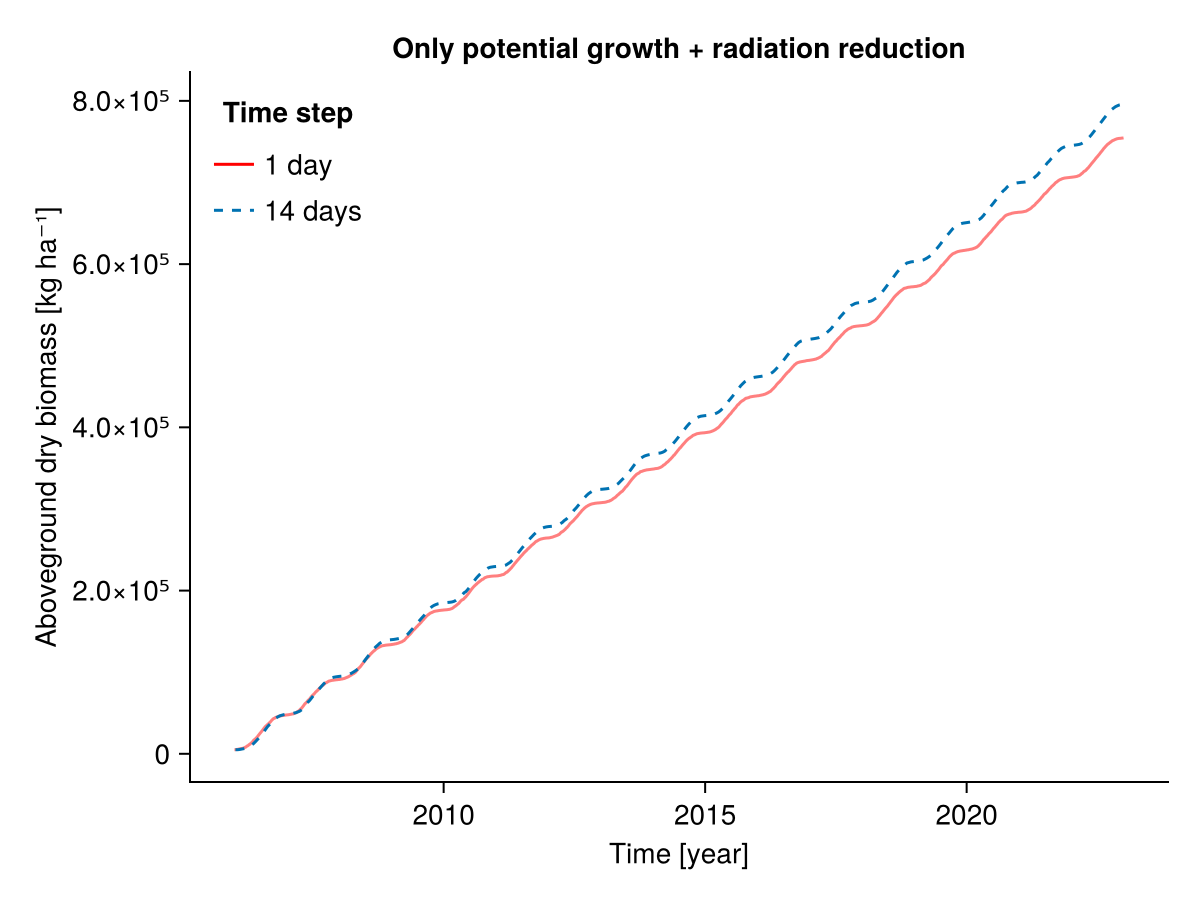
julia
########### Everything
plotID = "HEG01"
included = (;)
b1, b14, t1, t14 = calc_total_biomass(included, input14_HEG01; plotID)
fig = Figure()
Axis(fig[1, 1], ylabel = "Aboveground dry biomass [kg ha⁻¹]",
                xlabel = "Time [year]",
                title = "plotID: $plotID")
lines!(t1, b1; label = "1 day", color = :red, alpha = 0.5)
lines!(t14, b14; label = "14 days", linestyle = :dash)
axislegend("Time step"; position = :lt, framevisible = true)
fig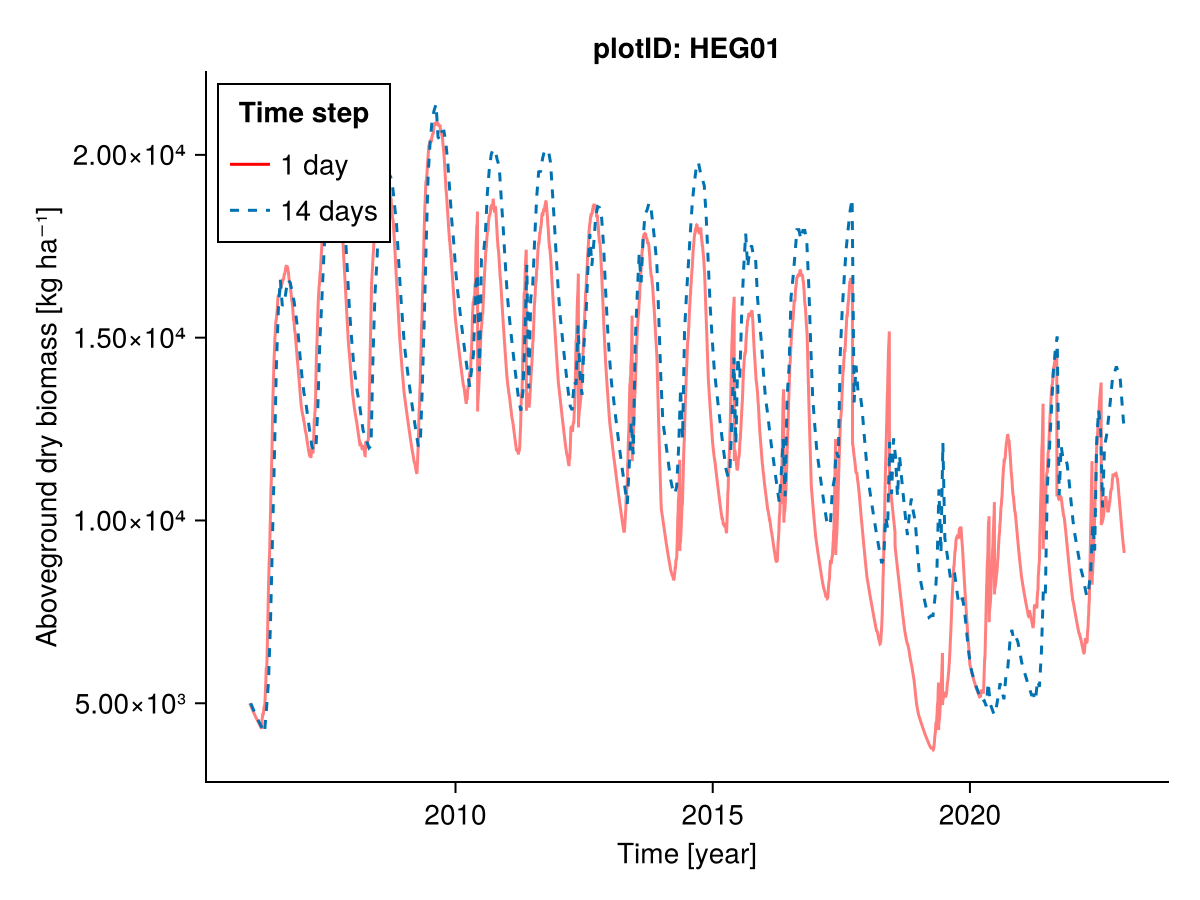
julia
########### Everything
plotID = "HEG07"
included = (;)
input14_HEG07 = sim.scale_input(sim.input_data.HEG07; time_step_days = 14)
b1, b14, t1, t14 = calc_total_biomass(included, input14_HEG07; plotID)
fig = Figure()
Axis(fig[1, 1], ylabel = "Aboveground dry biomass [kg ha⁻¹]",
                xlabel = "Time [year]",
                title = "plotID: $plotID")
lines!(t1, b1; label = "1 day", color = :red, alpha = 0.5)
lines!(t14, b14; label = "14 days", linestyle = :dash)
axislegend("Time step"; position = :lt, framevisible = true)
fig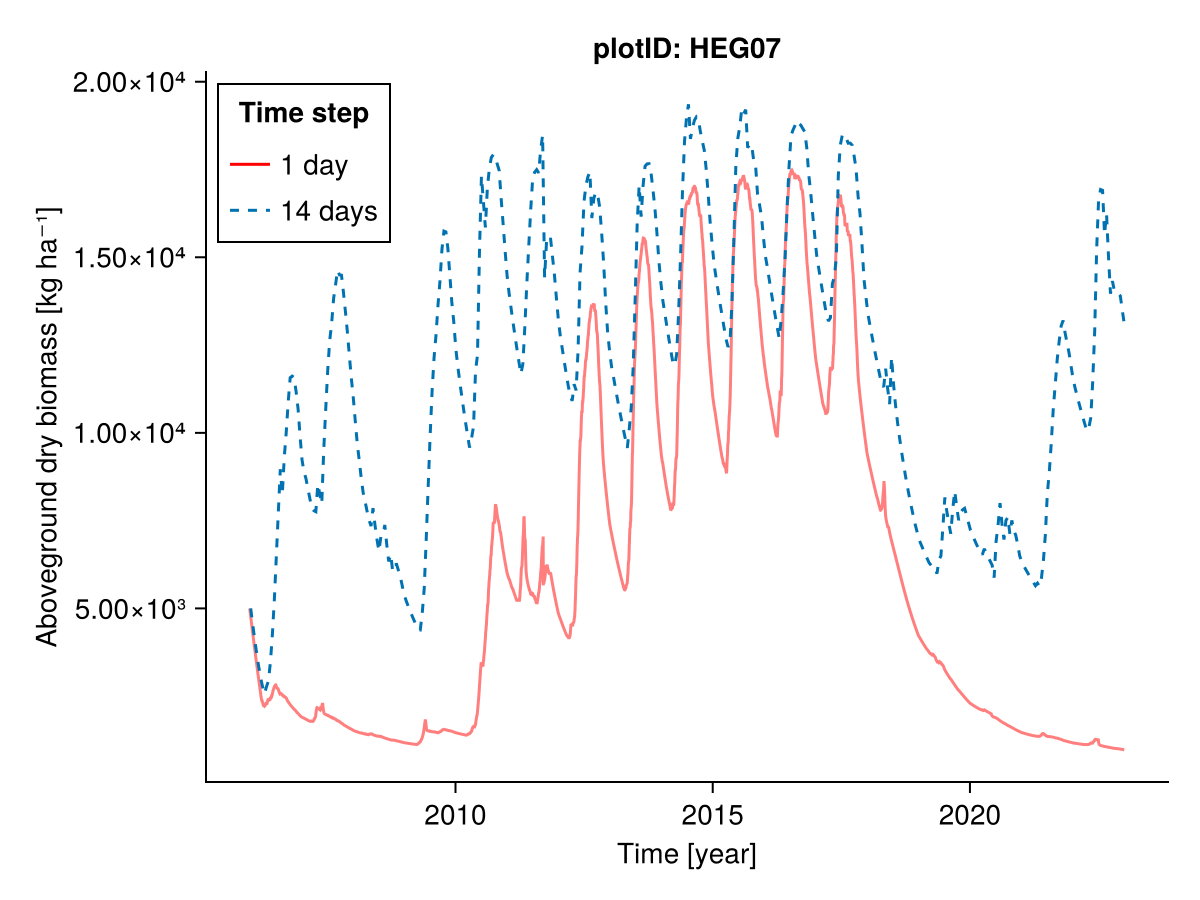
julia
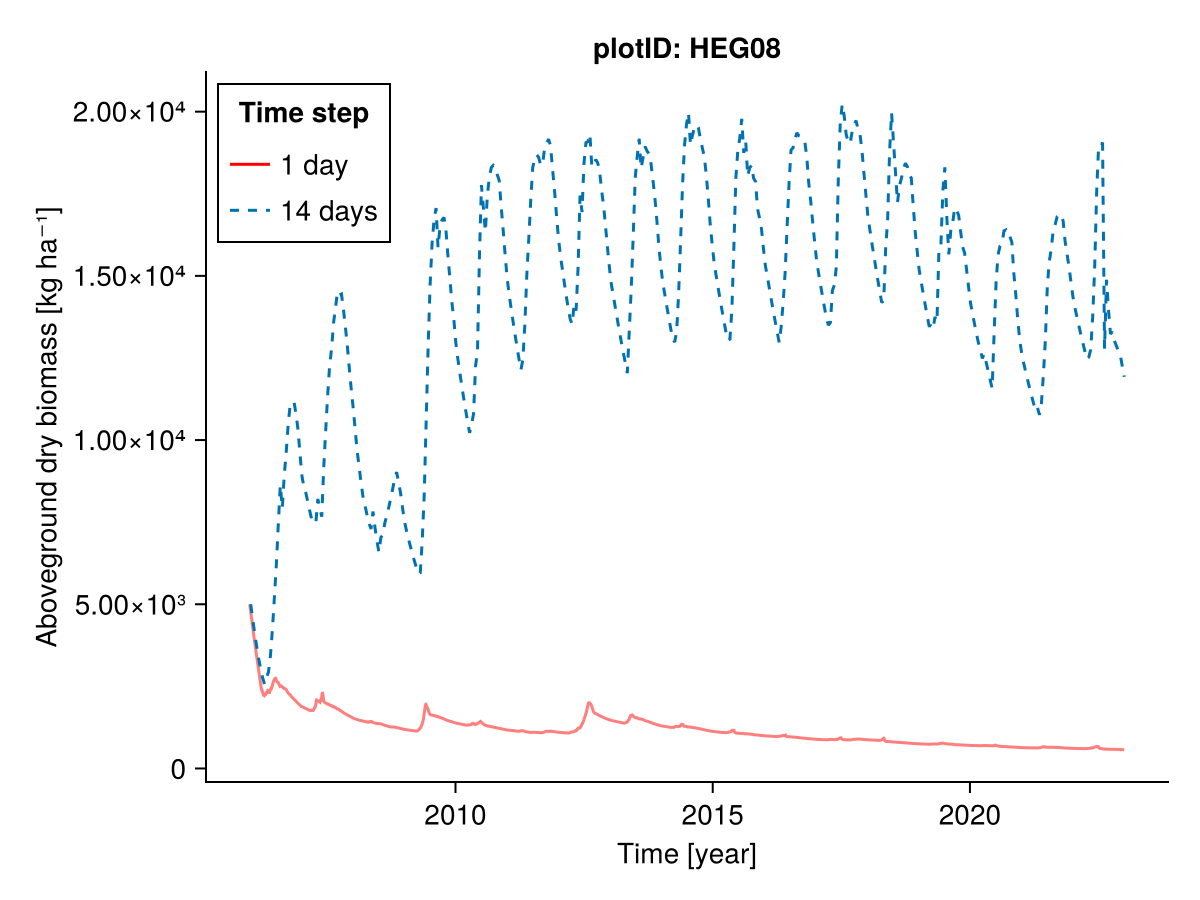
########### Everything
plotID = "HEG08"
included = (;)
input14_HEG08 = sim.scale_input(sim.input_data.HEG08; time_step_days = 14)
b1, b14, t1, t14 = calc_total_biomass(included, input14_HEG08; plotID)
fig = Figure()
Axis(fig[1, 1], ylabel = "Aboveground dry biomass [kg ha⁻¹]",
                xlabel = "Time [year]",
                title = "plotID: $plotID")
lines!(t1, b1; label = "1 day", color = :red, alpha = 0.5)
lines!(t14, b14; label = "14 days", linestyle = :dash)
axislegend("Time step"; position = :lt, framevisible = true)
fig